Dario Traum from Bloomberg New Energy Finance paid a visit to the Ashden offices on 21 February to give a talk around the key findings from the Climatescope 2017 report. First published in 2012, over 40 people helped to put the Climatescope report together this year.
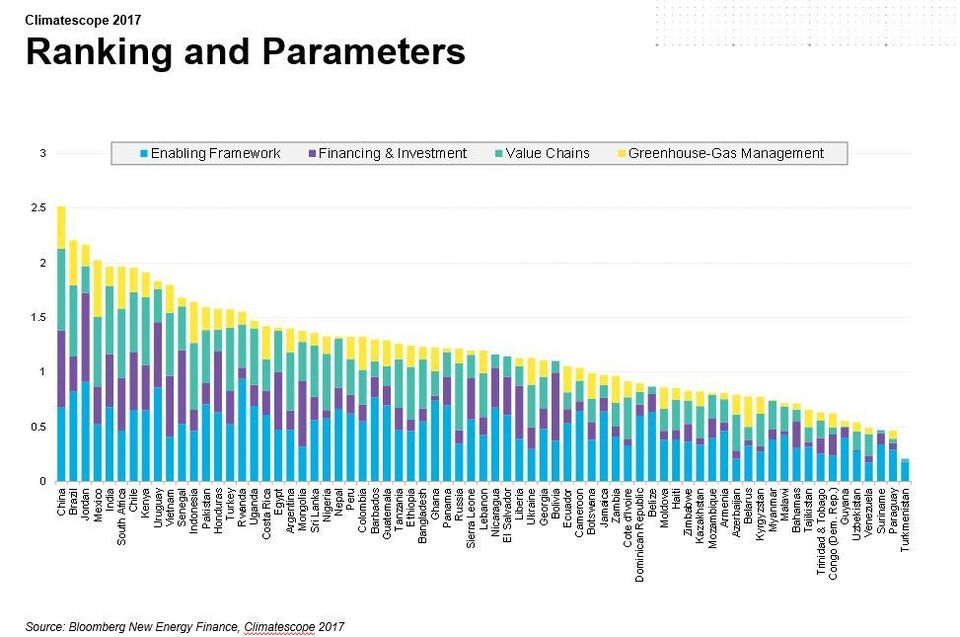
Four key parameters were used in the research: Enabling framework, financing and investment, value chains, and greenhouse gas management, and 71 markets were looked at, which includes 72% of the global population. Over two hundred data points per country were analysed, from 15,000 individual pieces of data.
Overall, there has been a large jump in the number of solar installations globally, although the number of investments has gone down. This is especially the case in China and is due to the cost of solar coming down and the investment in on-shore wind going up.
Using the four key parameters, the Index shows the profiles of 71 countries with the top five positions including China, Brazil, Jordan, Mexico, and India. The larger countries are generally doing better, but Jordan is a good example of a smaller country doing a lot in terms of investments and employment. While China scores the highest at just above 2.5, the top of the scale is at 5, so there is still a lot of room for improvement.

The biggest movements in 2016 include countries that have had a drop in their score. This is the first time any drops have been recorded since this report started, which is largely due to the cutback in global investment. Most notable among these is Uganda with a 0.57 drop. Uganda has always been a top performer because of their government incentives, but has dropped this year due to policy change, with no replacements to previous incentives. Other countries that have seen a score drop include the Latin America region, mainly due to saturation, and potential investment fatigue. The full report looks further into how quickly they can progress despite these issues.
One of the biggest increases in score comes from Barbados, thanks to its large integration of renewables to the grid. Other high performers include Senegal and Jordan, who did not have high access to fossil fuels like their neighbours, so the money they were spending on importing fuels is now being spent on domestic renewables.
The Paris Agreement has been incorporated into the methodology, with scores reflecting the commitments made – these are likely to change over the coming years. For more insight and the full report see here.
Key findings summary:
- There was a record drop in investment in clean energy in 2016.
- China sees drop in investment due to gap between its 5-year investment plans.
- Copenhagen’s COP15 was supposed to lead to $100bn of North-South investments by 2020 in climate change mitigation. In 2016 and with four years to go to reach that target, that figure was $11.8bn.
- Sub-Saharan Africa and South America have seen a drop in emerging market clean energy investment, as they are between large project investments. South Africa has brought the sub-Saharan average down due to policy difficulties.
- As costs of renewables decrease, we expect to see investment levels to remain steady but the capacity of installations increase.
- The number of emerging markets that receive more than $100 million investment in clean energy has stagnated at around 25 countries in one year.
- Investment intensity is relative to the size of the country’s GDP – most emerging markets are doing better than ‘poster-child’ Germany.
- Decarbonisation of power supply is key to reaching decarbonisation of the world.
- Europe is the lead source of cross-border clean energy investment – specifically commercial actors like large utilities.
- Three quarters of the countries reviewed have renewable energy target policies but only 35% have Feed-in Tariffs.
- Emerging markets are getting very close to being able to cope with around 70% variable renewable energy sources as part of their grid energy mix. They will probably hit this target next year.

